Key points
- Weekly jobless claims count applications for unemployment benefits. The U.S. Department of Labor publishes them each week, usually on Thursday at 8:30 a.m. ET.
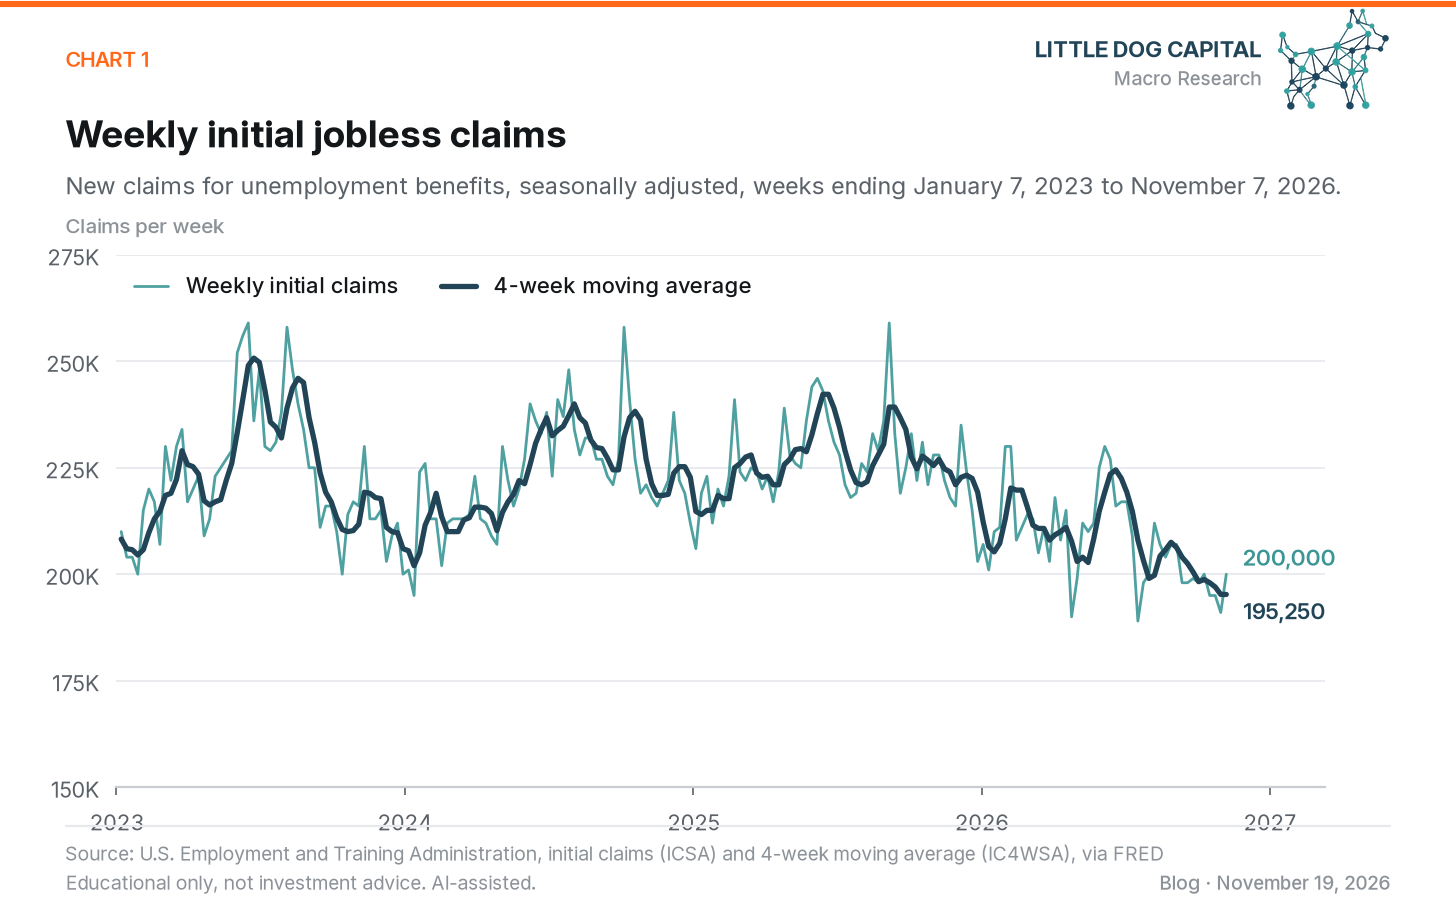
- In the week ending November 7, 2026, initial claims were 200,000, up 9,000 from the week before. The 4-week moving average was 195,250.
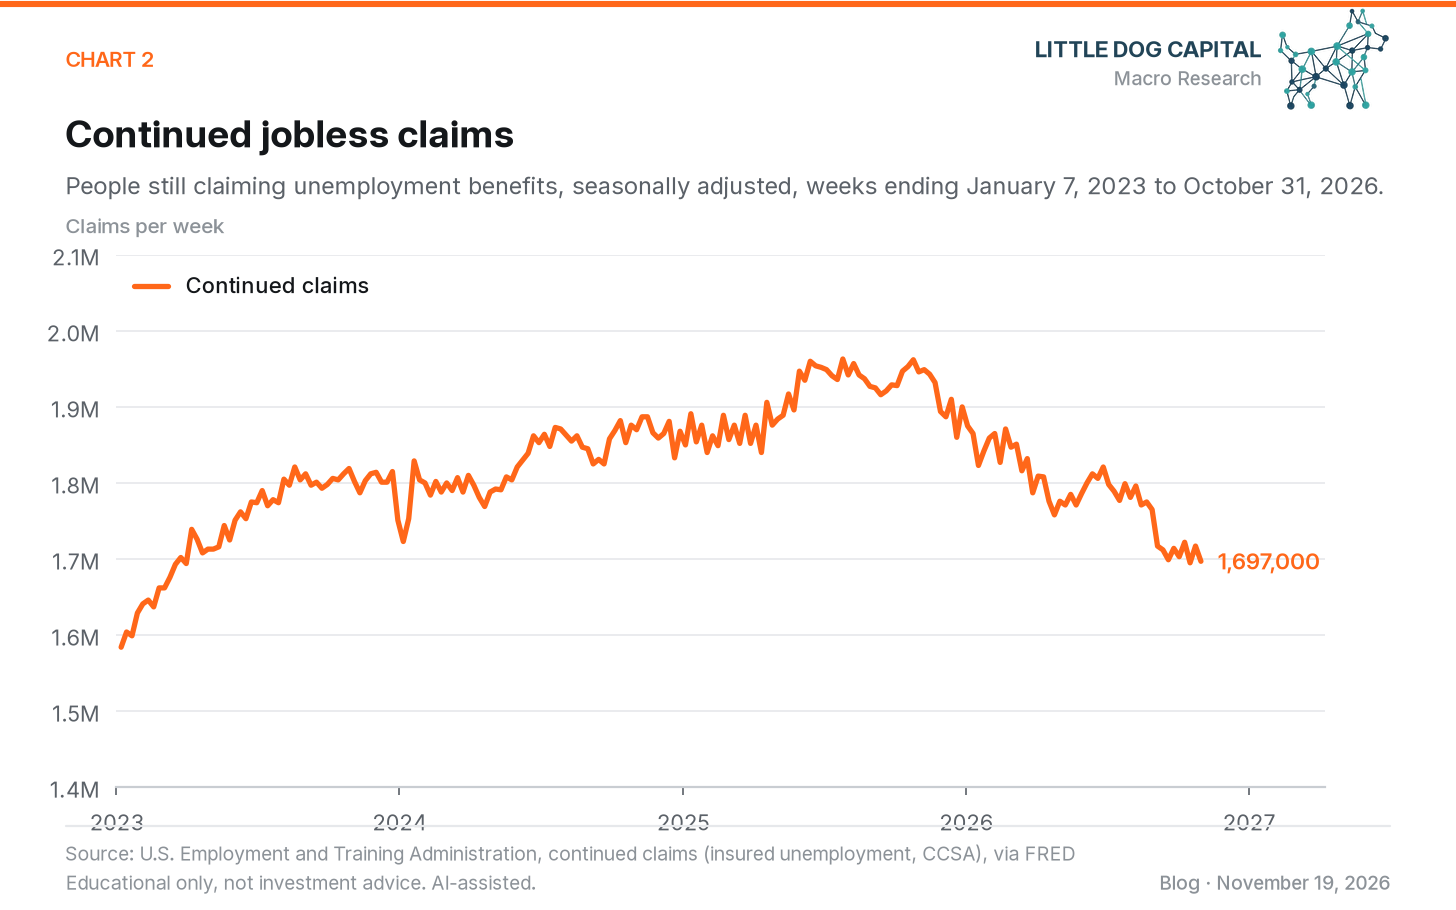
- Continued claims, which count people still claiming benefits, were 1,697,000 in the week ending October 31, 2026. A year earlier they were 1,946,000.
- A single week's figure can jump around, so the 4-week average and the trend over several months usually say more than one report.
Data through the week ending November 7, 2026 (initial claims) and the week ending October 31, 2026 (continued claims), from the Labor Department report released November 12, 2026. Figures are seasonally adjusted unless noted. Retrieved on November 18, 2026, from FRED, the data site run by the Federal Reserve Bank of St. Louis.
Many people who lose a job apply for unemployment benefits. Weekly jobless claims count those applications, so they're one of the quickest public readings on layoffs in the U.S. The Labor Department calls initial claims a leading economic indicator because they point to emerging conditions in the job market.
The numbers come from state unemployment insurance programs. The Employment and Training Administration, part of the Labor Department, adds them up and publishes a national total each week. Each claims week ends on a Saturday.
What jobless claims count
An initial claim is filed by someone who is out of work after leaving or losing a job. Filing asks the state to decide whether the person is eligible for benefits. So an initial claim is an application, not a payment.
A continued claim comes next. Someone who has already filed an initial claim and has been out of work for a week files a continued claim to collect benefits for that week. The Labor Department says continued claims, also called insured unemployment, are a good estimate of how many people with unemployment insurance are out of work and claiming benefits.
The two numbers answer different questions. Initial claims show how many people newly applied that week. Continued claims show how many people are still collecting. Continued claims are reported one week behind initial claims, so the November 12 report had initial claims through November 7 and continued claims through October 31.
The November 12 report
In the week ending November 7, 2026, initial claims were 200,000. That was 9,000 more than the week before. In the same week a year earlier, the week ending November 8, 2025, initial claims were 228,000.
The first number for each week is called the advance figure, and it's revised the following week. In the November 12 report, the Labor Department revised the prior week's initial claims up by 2,000, from 189,000 to 191,000.
Continued claims were 1,697,000 in the week ending October 31, 2026, down 20,000 from the week before. That was about 1.1% of the roughly 154 million jobs covered by unemployment insurance, a figure the Labor Department calls the insured unemployment rate.
Why the 4-week average helps
Weekly claims can swing from one week to the next. The Labor Department notes that they're weekly administrative data that are hard to seasonally adjust, which makes the series somewhat volatile.
Seasonal adjustment removes patterns that repeat around the same time each year, such as holidays, weather, and schools opening and closing. Here is an example from the November 12 report. Before adjustment, initial claims rose 16.2% in the week ending November 7. The seasonal factors expected a rise of 11.0% for that week. Because claims rose more than the usual seasonal pattern, the adjusted figure went up too.
The 4-week moving average smooths out some of that noise. It's the average of the latest four weeks. In the November 12 report, those weeks were 195,000, 195,000, 191,000 and 200,000, so the average was 195,250. It was unchanged from the previous week's revised average.
Putting the number in context
Earlier years give the latest numbers some context. In 2019, before the spike in 2020, weekly initial claims averaged about 218,000. In 2026, through the week ending November 7, they averaged about 208,000. The lowest week so far in 2026 was 189,000, in the week ending July 18.
Claims can also change very fast. In the week ending March 7, 2020, initial claims were 208,000. Four weeks later, in the week ending April 4, 2020, they were 6,137,000. That's the highest weekly figure in the FRED series, which starts in 1967.
Continued claims add a second view. They were 1,697,000 in the week ending October 31, 2026, compared with 1,946,000 in the comparable week of 2025. The Labor Department says continued claims aren't a leading indicator. They tend to move with the economy near its peaks and lag behind it near its low points, so they mostly confirm what other data show.
What claims don't tell you
Claims only count people who apply for unemployment insurance. Someone who loses a job and doesn't file won't show up, and someone who files may turn out not to be eligible.
Claims also don't count hiring. Low initial claims mean relatively few people are applying for benefits. They don't show how long it takes someone to find a new job. Continued claims give a partial view of that, because they rise when people stay on benefits longer.
What to watch
The Labor Department publishes a new claims report each Thursday at 8:30 a.m. ET, except when Thursday is a federal holiday. The report scheduled for Thursday, November 19, 2026, covers initial claims for the week ending November 14 and isn't included in the figures above. Because of Thanksgiving, the following report is scheduled for Wednesday, November 25, 2026.
When you read a claims report, it helps to check a few details. Look at whether the figure is seasonally adjusted, and whether it's the advance figure or a revised one. Compare the weekly number with the 4-week average, and look at continued claims in the same report.
None of this is a forecast of where the job market is headed. It's a way to read the weekly claims report and to see what it can and can't say about layoffs.
This post was drafted with AI assistance and reviewed by a human before publication.