Key points
- The Consumer Price Index (CPI) tracks prices for a large basket of goods and services, weighted by how much urban consumers spend on each one.
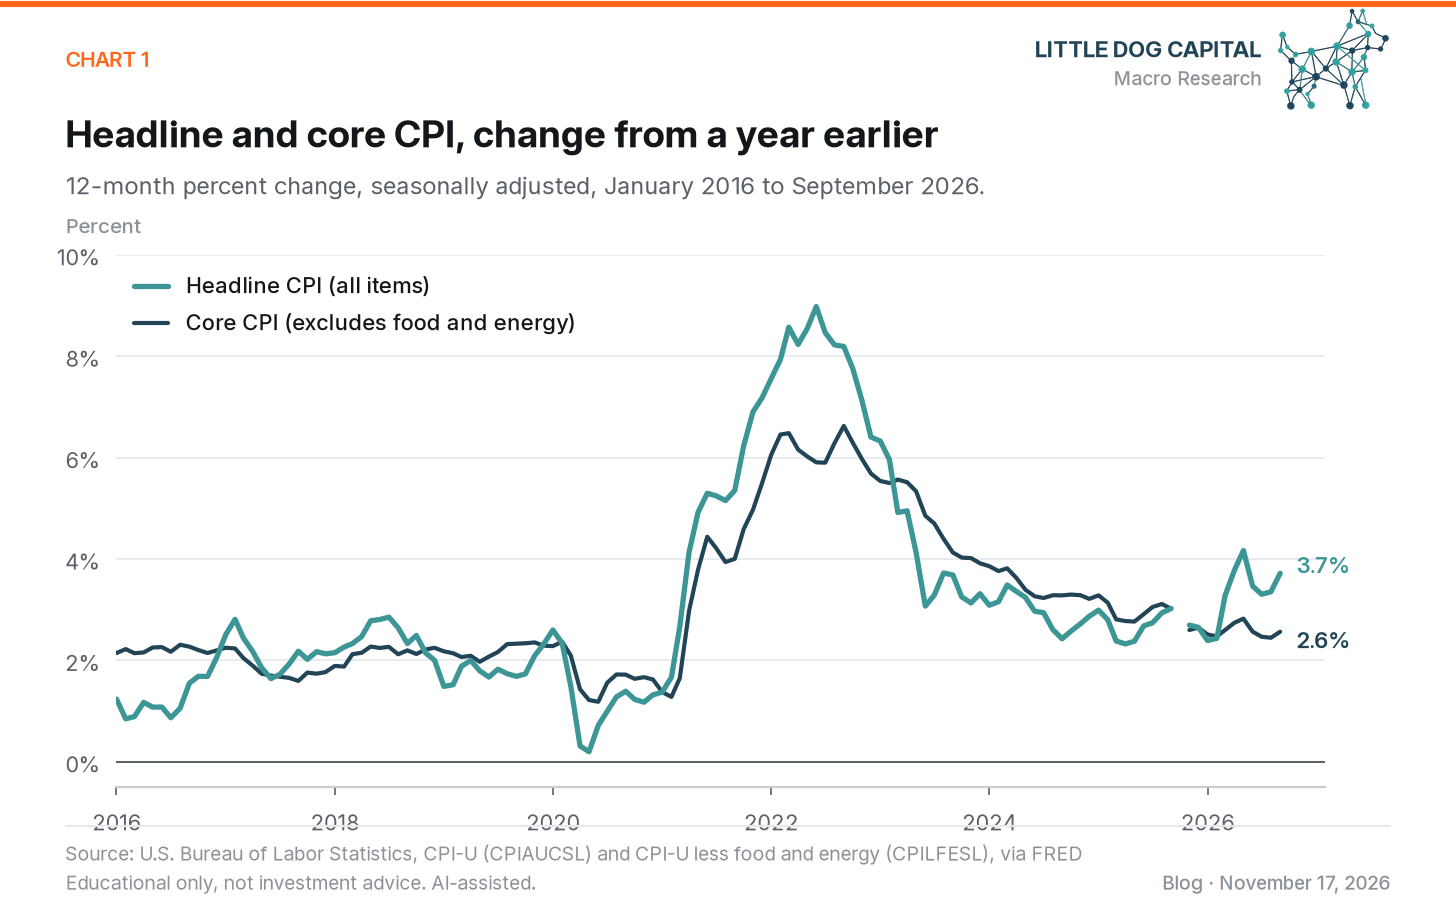
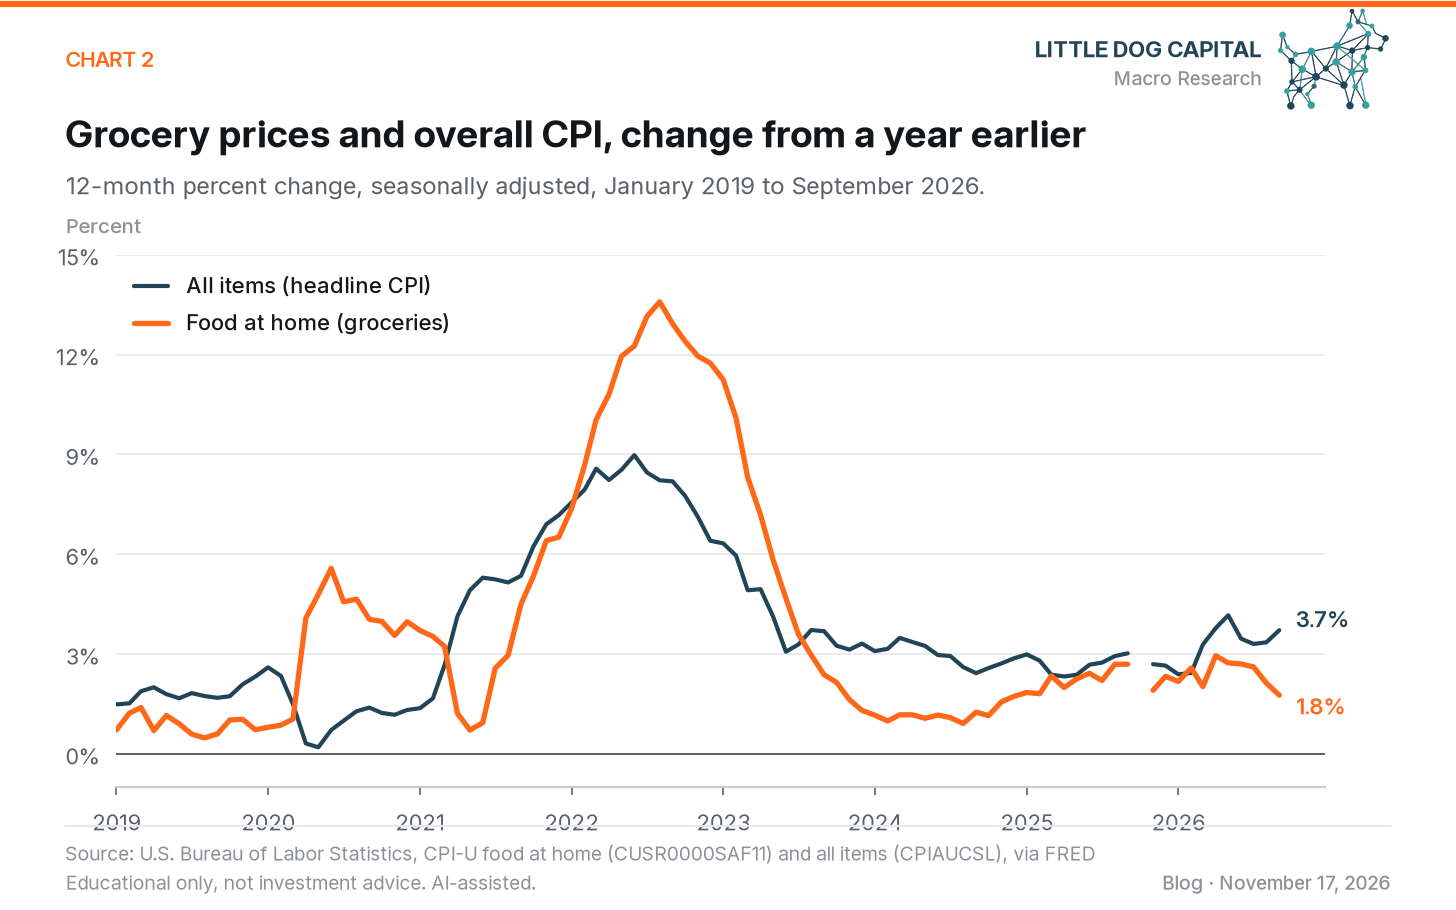
- In September 2026, headline CPI was 3.7% higher than a year earlier, core CPI was 2.6% higher, and grocery prices were 1.8% higher.
- In October 2026, headline CPI rose 0.4% from September, core CPI rose 0.3%, and grocery prices rose 0.4%.
- Groceries are about 8.3% of the CPI basket, so your own costs can rise faster or slower than the index depending on what you spend your money on.
Your grocery bill and the inflation rate in the news can tell different stories, and both can be accurate. The Consumer Price Index is an average across many kinds of spending and many households. Your own shopping cart is one small part of it.
The U.S. Bureau of Labor Statistics (BLS) publishes the CPI every month. In September 2026, headline CPI was 3.7% higher than a year earlier. Prices for food at home, the BLS category for groceries, were up 1.8% over the same 12 months. These figures are calculated from the seasonally adjusted index values on FRED, the data site run by the Federal Reserve Bank of St. Louis. The 12-month changes BLS reports itself use data that aren't seasonally adjusted, so they can differ slightly.
What the CPI measures
The CPI measures the change in prices that consumers pay for goods and services. BLS prices a large basket of items, including food, clothing, rent, fuel, transportation, doctors' and dentists' services, and medicines. Each month, it collects prices in 75 urban areas, from about 6,000 housing units and about 22,000 stores and service businesses.
Each item in the basket gets a weight based on how much urban consumers spend on it. In the weights BLS published for December 2025, shelter made up about 35.6% of the index. Shelter is mostly rent paid by renters and an estimate of what owned homes would rent for. Food at home made up about 8.3%, and energy made up about 6.4%.
The headline number most people hear about is the CPI for All Urban Consumers, or CPI-U. BLS says this group represents over 90% of the U.S. population. It leaves out people in rural areas outside metro areas, farm families, people in the armed forces, and people living in institutions such as prisons. So the CPI describes the average urban consumer, not any one family.
Headline CPI and core CPI
Headline CPI covers every item in the basket. Core CPI is the same index with food and energy taken out. BLS calls it "all items less food and energy," and it made up about 79.9% of the basket in the December 2025 weights.
Food and energy are left out of core because their prices tend to jump around from month to month. In 2026, the BLS energy index fell 5.7% in June and rose 5.2% in September, after seasonal adjustment. Taking those swings out can make the slower trend in other prices easier to see. Core isn't a better or truer measure, though. Food and energy are real costs, and headline CPI includes them.
When headline CPI runs above core, prices for food, energy or both have been rising faster than everything else. In September 2026, headline CPI was up 3.7% from a year earlier and core CPI was up 2.6%. Grocery prices rose 1.8% over the same year, slower than both.
Monthly and yearly changes
News reports usually give two numbers for each CPI release. The monthly change compares this month's index with last month's. The 12-month change, often called the year-over-year rate, compares this month's index with the same month a year earlier.
Here is how the 12-month figure works. The seasonally adjusted headline index was 324.245 in September 2025 and 336.298 in September 2026. Divide the newer level by the older one and subtract 1. The result is a rise of about 3.7%.
Monthly changes are small numbers that are easy to misread. In October 2026, headline CPI rose 0.4% from September, core CPI rose 0.3%, and grocery prices rose 0.4%. A month earlier, in September, headline CPI rose 0.6% while grocery prices fell 0.1%. A single month can be noisy, so it helps to look at several months together or at the 12-month change.
Monthly figures are usually seasonally adjusted. Seasonal adjustment removes price patterns that repeat around the same time every year, so one month can be compared fairly with the next.
The latest 12-month figures in this post are for September 2026, not October. BLS did not collect survey data for October 2025 because of a lapse in federal funding. As a result, BLS says it can't publish 12-month changes for October 2026 for most indexes.
Why your grocery bill can differ from the CPI
The CPI is built to describe the average urban consumer, so your own costs can move differently from it.
Your spending mix can differ from the basket. Groceries are about 8.3% of the CPI basket. If groceries or gasoline take up a bigger share of your budget, you feel those prices more than the index does.
Your items can differ, too. The food-at-home index averages many products. In October 2026, BLS reported that beef prices rose 0.9% while nonalcoholic beverage prices fell 0.3%.
Where you live matters. The headline CPI is a U.S. city average. BLS also publishes separate indexes for regions and for some metro areas.
The CPI tracks prices, not your total bill. If you purchase more, switch brands or shop at a different store, your receipt changes even when prices don't.
Grocery prices have run both above and below overall inflation in recent years. In August 2022, on a seasonally adjusted basis, the food-at-home index was 13.6% higher than a year earlier, while headline CPI was up 8.2%. In September 2026, grocery prices were up 1.8% and headline CPI was up 3.7%.
What to watch
BLS has scheduled the November 2026 CPI report for Thursday, December 10, 2026, at 8:30 a.m. ET. FRED already shows index values for November 2025, so a 12-month change for November 2026 can be calculated once the new data are out.
When you read the next report, it helps to check which number is being quoted. Look for whether it's headline or core CPI, and whether it's a monthly change or a 12-month change. The food-at-home index, the closest match to a grocery bill, is in the same report.
None of this is a forecast of where prices are headed. It's a way to read the monthly CPI report, and to see why one household's costs can move differently from a national average.
This post was drafted with AI assistance and reviewed by a human before publication.