Key points
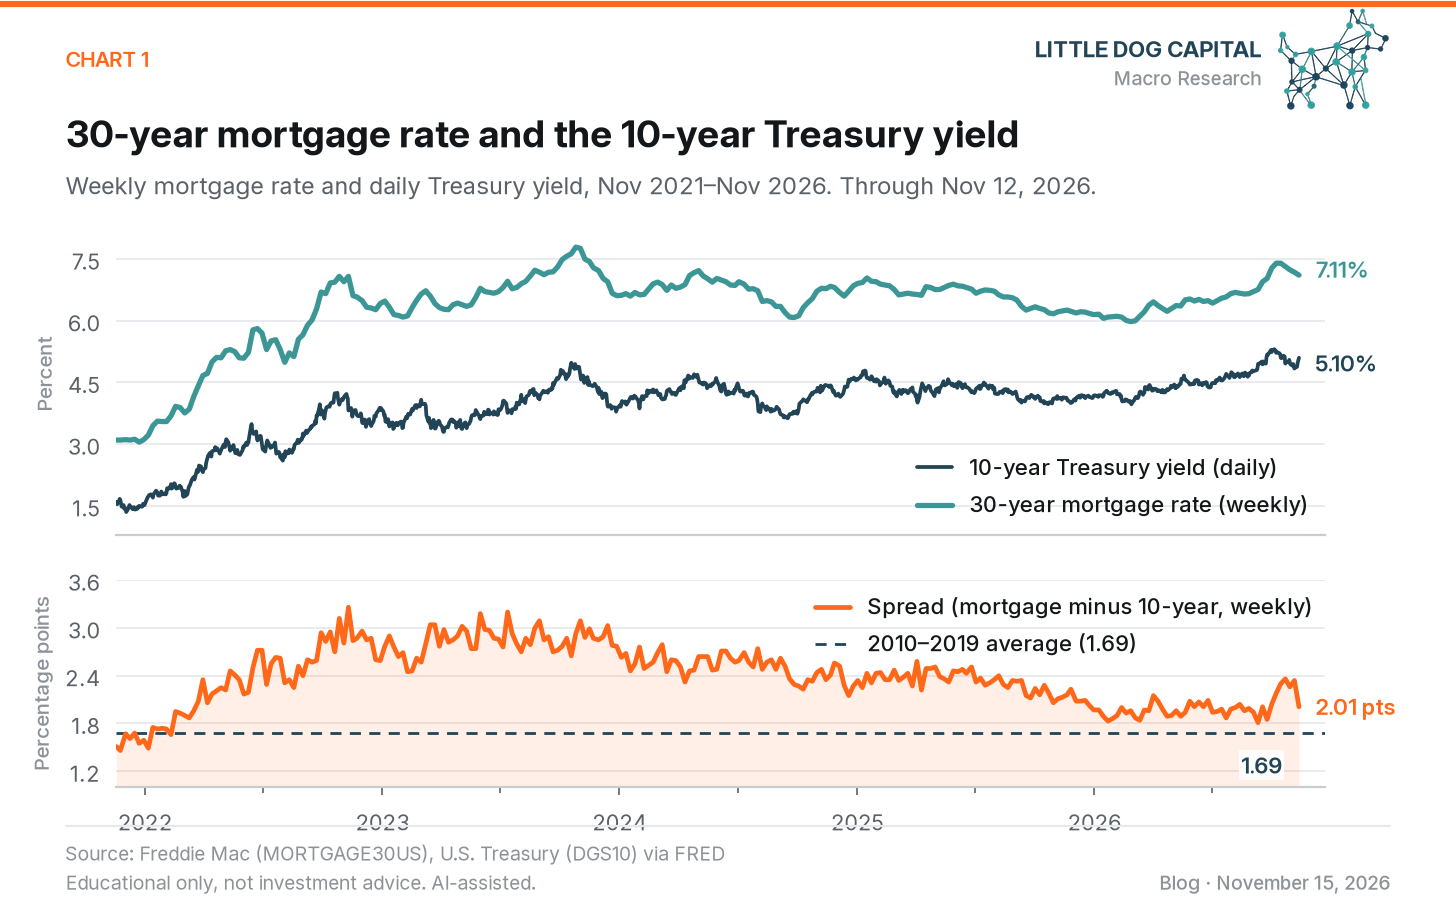
- The 30-year mortgage rate was 7.11% in the week of November 12, 2026, and the 10-year Treasury yield was 5.10%, a spread of 2.01 percentage points.
- When the 10-year yield rises, new mortgages usually get more expensive; when it falls, mortgage rates often follow.
- The spread averaged 1.69 points in 2010–2019, 2.42 points since 2022, and 2.00 points so far in 2026.
- The two can split in a single week: in the latest week, the mortgage rate fell while the 10-year yield rose.
A 30-year mortgage is one of the biggest financial commitments many families make. The rate on that loan does not come out of thin air. Week after week, it tends to follow a number most people never look at: the yield on the 10-year U.S. Treasury note.
They are not the same rate. In the week of November 12, 2026, the average 30-year fixed mortgage rate was 7.11%, according to Freddie Mac's Primary Mortgage Market Survey. The 10-year Treasury yield that day was 5.10%. The difference — 2.01 percentage points — is called the spread.
Why they travel together
When a lender makes a 30-year loan, it is tying up money for a long time. The 10-year Treasury yield is the market's going rate for a long-term loan to the U.S. government, and it is the usual starting point for pricing new mortgages. If the 10-year yield rises, new mortgages usually become more expensive. If it falls, mortgage rates often follow.
Lenders look at the 10-year, rather than a 30-year Treasury, because many mortgages are paid off early, when a household moves or refinances. A typical 30-year loan does not last a full 30 years, so a 10-year yield is a closer match to how long the loan is actually expected to last.
Over the past five years, the two series have risen and fallen together. The 30-year average was as low as 3.05% in the week of December 23, 2021, and as high as 7.79% in the week of October 26, 2023, with the 10-year yield moving in the same direction along the way.
What the spread is paying for
The mortgage rate is almost always higher than the 10-year yield. That spread covers things a Treasury note does not have: the risk that a borrower falls behind, the risk that many borrowers refinance at once if rates drop, the cost of making and servicing the loan, and compensation for taking those risks.
From 2010 through 2019, the weekly spread averaged 1.69 percentage points. From 2022 through the latest reading, it averaged 2.42 percentage points. So far in 2026, it has averaged 2.00 percentage points — closer to the 2010s typical gap than to the wider years after 2022, though still a little above that earlier average.
The case against reading them as one number
The two rates can still part ways in a single week. In the week of November 12, 2026, the average 30-year mortgage rate declined from 7.18% the prior week to 7.11%, while the 10-year Treasury yield rose from 4.84% to 5.10%. The spread shrank from 2.34 points to 2.01 points in seven days.
Part of that can be timing. Freddie Mac's survey is published on Thursday and reflects lender quotes collected earlier in the week. The Treasury yield used here is the close on that same calendar day. A move late in the week can show up in mortgage quotes the following week.
The spread also changes when those extra risks change. If demand for mortgage-backed securities weakens, or if concerns about prepayment or missed payments rise, the gap can widen even if the 10-year yield is steady. If those pressures ease, the gap can narrow. In 2026, the weekly spread has been as tight as 1.81 points, in the week of September 10, and as wide as 2.36 points, in the week of October 22.
What to watch
A lasting move in the 10-year Treasury yield, up or down, has historically been followed by a move in mortgage rates, though not always immediately or one-for-one. A change in demand for mortgage-backed securities, or in how costly it is to originate and service loans, would show up more in the spread than in the Treasury yield itself. A shift in how often borrowers refinance or move, which changes the expected life of a 30-year loan, can lead lenders to lean on a different Treasury benchmark or a different gap.
None of that is a forecast of where rates are headed, and it is not a verdict on whether the current spread is "too wide" or "too narrow." It is a way to read two public numbers together instead of in isolation.
This year's path, in brief
The 30-year average was 6.16% in the week of January 8, 2026, and reached its year-to-date low of 5.98% on February 26, when the 10-year yield was 4.02%. It later reached 7.40% in the weeks of October 8 and October 15. The latest reading, 7.11%, is 0.87 percentage points above the 6.24% of a year earlier, in the week of November 13, 2025. Over the same span, the 10-year yield rose 0.99 percentage points, from 4.11% to 5.10%. The spread is slightly narrower than it was a year ago.
This post was drafted with AI assistance and reviewed by a human before publication.